Many people may not know this, but SimGrid is a significant partner of SRO Esports and a lot of SimGrids technology is used in the background to make these events run smoothly. One of these technologies used is its performance analysis tool, which measures data and gives in-depth statistics between drivers and teams.
We have a few areas that we will analyse with you, so if you are someone who loves a good stat, perch yourself on something comfortable and get ready to read. Some main talking points we will focus on are:
- Which drivers were the best
- Which driver combos were best
- Who made the least mistakes
- Which teams were the most consistent
- Which manufacturers reigned supreme
The obvious takeaways are the double-trio of podiums in Pro class and Silver class as the Mercedes AMG GT3 Evo occupied the top 3 spots in Pro and the Aston Martin V8 Vantage occupied the top 3 spots in the Silver class. But these podiums only show a fraction of what happened and can skew the views of onlookers.
A major factor that decided the podiums were strategy calls, timings of pitstops and unfortunate driver disconnections, for example, it took the Mercedes until hour 5 of the race to hit the front and up until hour 7 of the race 2 Audis were in the podium spots, but let’s see what the stats say up and down the grid for those that did finish the race.
THE CAR STATS
Valid Laps %
Audi had the best Valid Laps % with a whopping 90.3% of their laps valid. McLaren follows in second at 88.58%. Honda seemed to struggle in comparison with only 74.97% of their laps being valid.
This figure is greatly affected by how many cars of one particular manufacturer were present. The likes of the Ferraris, Mercedes and Astons which make up 50% of the entire grid will make it harder for them to appear here due to so many variations from the 25 teams. Which is in contrast to the 2 McLarens or 4 Audi’s.
Grouped Analysis of the Spa24 can be analysed here.
Valid Laps Average
Mercedes-AMG had the fastest Valid Lap Average at 2:17.955 but Ferrari was only 0.051 behind at 2:18.006 over the entire 24 hours. Audi came third at 2:18.085 (+0.130). The Aston Martin’s in Silver class were fourth fastest at 2:18.307 and the McLaren rounded out the Top 5 at 2:18.436 (+0.481).
The Best Laps
It’s the same Top 5 cars when we look at Best Lap, albeit in a different order, with Mercedes-AMG fastest at 2:16.085. Ferrari again is second at 2:16.180 (+0.095) with McLaren’s best lap being identical to Ferrari’s! The Audi came next at 2:16.200 (+0.115). With the Aston Martin rounding out the Top 5 with a best of 2:16.437.
Optimal Laps
The Top 5 is the same again when we look at Optimal Lap, with Mercedes-AMG once more leading the way with a 2:15.722.
Aston Martin, Audi, Ferrari and McLaren were 2-tenths away from Mercedes-AMG on this optimal lap metric, but between them, they are separated by only 0.080! (AMR at 2:15.924 and McLaren at 2:16.004)
THE TEAM STATS
Valid Laps %
ITB Sainteloc Racing and Automobili Lamborghini Esports Team are tied at the top in Pro class with 90.59% of their laps being valid. But both are beaten by Team Racing Point in Silver class who have the best Valid Lap Percentage at 91.43%, showing they were truly dominant on their way to the win and fourth place overall.
Valid Laps Average
When focusing on Valid Lap Averages, the fastest 11 teams are separated by only 0.260s. The fastest four teams were separated by only 0.028s. The fastest two teams separates by only 0.002!
| Team Name | Time | Difference |
|---|---|---|
| Williams Esports – Mercedes-AMG Team | 2:17.926 | – |
| Scuderia Ferrari Esports Team | 2:17.928 | +0.002 |
| Mercedes-AMG Esports Team Unicorns of Love | 2:17.951 | +0.025 |
| Mercedes-AMG Esports Team HRT by UOL | 2:17.954 | +0.028 |
The 6th to 10th fastest teams were 0.2s off the fastest 4, but they were separated by only 0.052s!, SMP Racing Esports were 6th fastest at an average of 2:18.134, Williams Esports were 11th fastest at an average of 2:18.186.
Despite coming in with the joint-second fastest Best Lap, and fifth best Optimal Lap, the Veloce McLaren team struggled on Valid Lap Average and is 0.510 off with an average lap of 2:18.436.
Mercedes Teams Consistency
We saw in the Car Stats that Mercedes-AMG was quickest across Valid Lap Average, Best Lap and Optimal Lap, and the trend continues when looking at teams but it’s a different Mercedes-AMG team for each stat:
| Team Name | Achievement | Time |
|---|---|---|
| Williams Esports – Mercedes-AMG Team | Best Valid Lap Average | 2:17.926 |
| Mercedes-AMG Esports Team HRT by UOL | Best Lap | 2:16.085 |
| Mercedes-AMG Esports Team Unicorns of Love | Best Optimal Lap | 2:15.862 |
INDIVIDUAL DRIVER STATS
Valid Lap %
37 drivers of the 45 that started the race have a Valid Laps Percentage of 90%+. Charlie Crossland has the highest with 93.9% but he did a relatively small amount of laps with 82 laps valid.
Amedeo Castorino did the 9th most laps of any driver (216) and 200 of those were valid, giving him a Valid Lap Percentage of 92.59%. He was a significant factor in why his team ran away with the victory in the Silver class and only two other drivers would have 90%+ valid laps with over 200 laps completed, those being Tinko van der Velde and David Tonizza.
Houben Was The Star Driver
Niklas Houben set the Best Lap of the race with a 2:16.0285 and also the best Optimal Lap of the race with a 2:15.892. Niklas also set the best stint of any driver, with an average lap time of 2:16.546. All three were set in the same hour showing Niklas hit a purple patch with his driving, with the track conditions and with his Mercedes during this stage of the race.
- 5 of the 10 drivers with the best Valid Lap Averages were on the podium
- Scuderia Ferrari (P4) and Mercedes-AMG Esports Team Unicorns of Love (P1) were the only teams to have two drivers in the Top 10 best Valid Lap Averages and Top 10 Best Laps.
Optimal Laps
When it comes to Optimal Laps, 3 of the 4 drivers of the Mercedes-AMG Esports Team Unicorns of Love are in the top 10, just showing you the combined strength of these driver pairings in this team.
Because of the weather, strategies throughout the race were mostly off-set, but in a period where the #4, #555, #5 Mercedes-AMG and #63 Lamborghini were all on an identical strategy (stints 3/4/5), they were very close.
Stint 5 below:
| Driver Number | Driver Name | Average Time | Best Time |
|---|---|---|---|
| #4 | Michael Tauscher | 2:18.073 | 2:16.990 |
| #555 | Dennis Schoeniger | 2:18.093 | 2:16.975 |
| #5 | Niklas Houben | 2:18.043 | 2:16.942 |
| #63 | David Tonizza | 2:18.157 | 2:17.085 |
The two stints prior (stint 3/4) also had the #63 Lamborghini matching the pace of the #4 and #5 Mercedes-AMG when David Tonizza and Alberto Garcia were driving.
It is harder to compare the Lamborghini to the AMG after this point as they were always on different strategies, but until Tonizza gets back in the car with 10h to go, the drivers of the Automobili Lamborghini team were not able to match the drivers of any Mercedes-AMG GT3 Evo teams at the front.
TO SUMMARISE
Everything you see here is really just touching the surface of what Performance Analysis can bring to you and we have only just touched on a small number of teams and drivers in this article. You can view any of the 150+ driver and any of the 45+ teams competing.
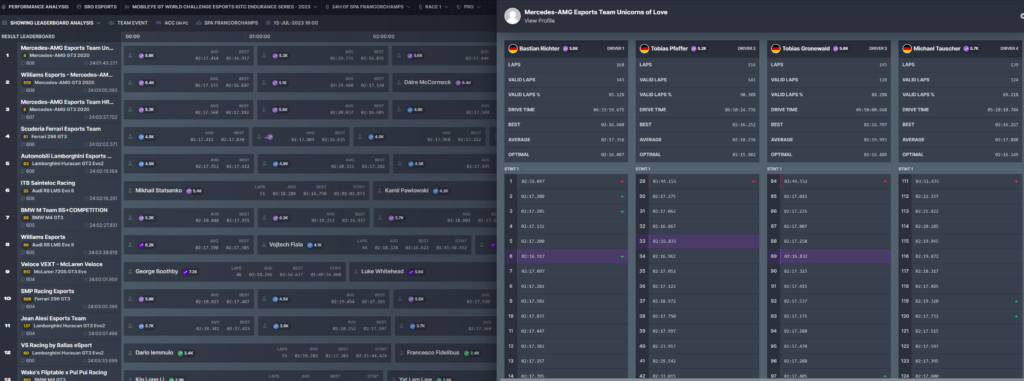
Click on a team name and get a highly detailed breakdown of every lap completed by each driver along with a summary of their stint performance:
- Fastest Laps
- Valid Lap %
- Rising Average
- Positions Gained
- Positions Lost
- Laps from every Stint
- Stint Driving Time
If you compete in any of the SRO Esports series yourself as a team or driver you can access much more data that is useful to analyse your performances through the year.