One of my favourite things as a racing driver is comparing my performance to other drivers after a race. In the real world we do this with reports from The B Pillar and HH Timing. But in the sim racing world high quality race reports are hard to find and difficult to use.
Over a year ago we started work on our own version of post-race reports and today it is finally ready for launch.
Performance Analysis is a new product from SimGrid that will allow you to get into the details of your race performance. Everything from average lap times, valid lap percentages, consistency scores, fastest laps and a bunch more. You will finally have a clearer understanding of your performance compared to team mates and competitors.
Performance Analysis is a SimGrid Pro feature and to make it more accessible to everyone I have decided to reduce the price of Pro by over 50%. Going forward a Pro subscription will cost €1.99 instead of €5.00.
Now… let’s dive into some of the features!
Dive deeper into Driver Swap race results
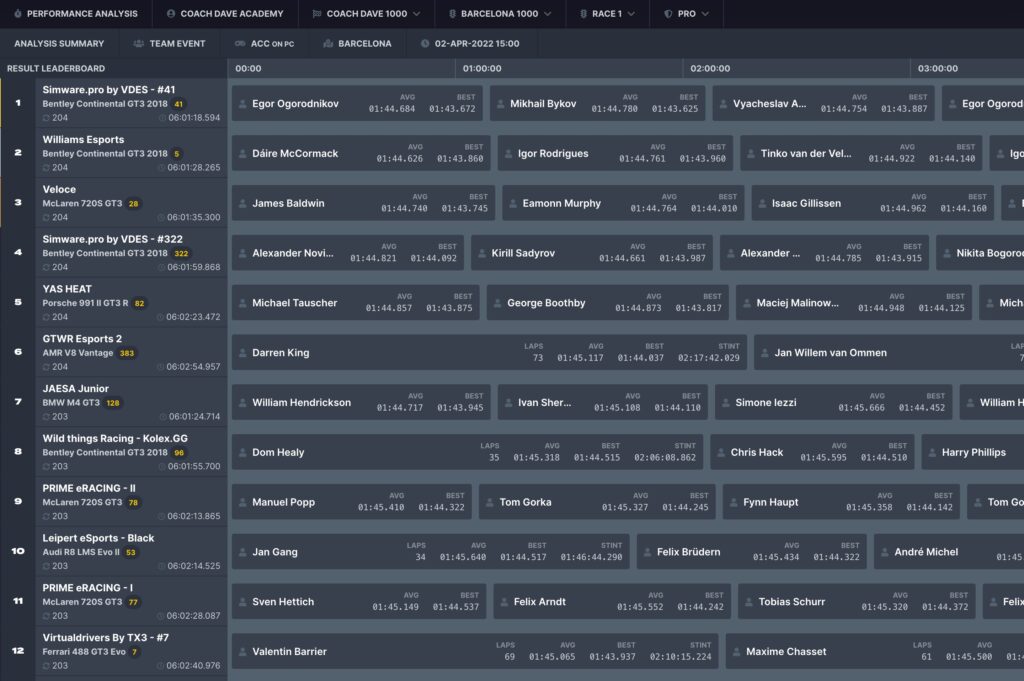
The primary feature of Performance Analysis is our driver swap stint interface. Browse this page for a high level view of how each team performed. Get an instant feel of the performance of every driver involved in the race, from average laps to best laps and stint lengths.
Then, click on a team name and get a highly detailed breakdown of every lap completed by each driver along with a summary of their stint performance.
- Fastest Laps
- Valid Lap %
- Rising Average
- Positions Gained
- Positions Lost
- Laps from every Stint
- Stint Driving Time
View a demo of Driver Swap reports and discover more about Performance Analysis
Discover how you did in your Solo Events
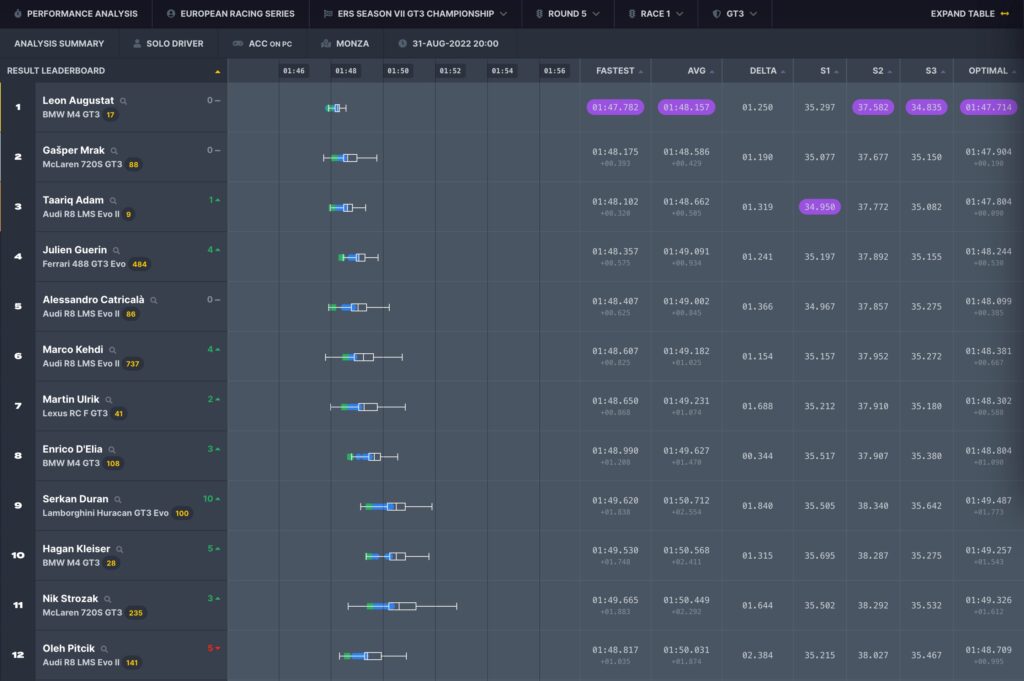
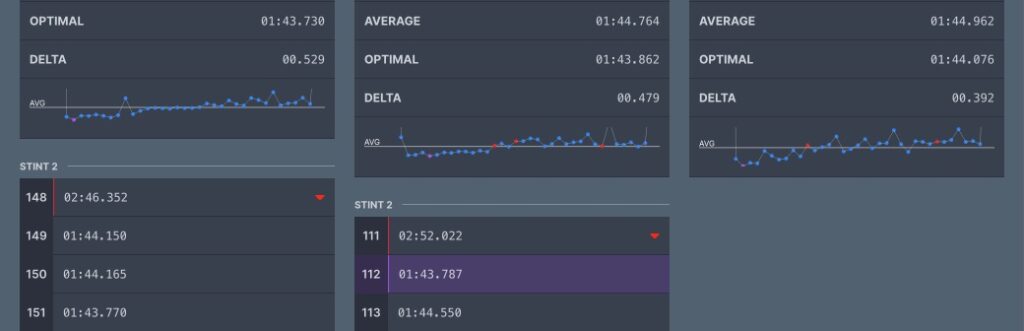
Solo driver events have a slightly different interface that focuses more on lap times instead of stints. Inspired by my favourite real life reports from The B Pillar we have produced graphics that give an overview of a driver’s stint, showing best laps, average times and your potential best laps.
Clicking on any driver will open up a separate report that goes into further detail:
- Start position
- Finishing position
- Positions gained and lost on each lap
- Valid laps and valid lap %
- Best, average and optimal laps
- An expandable graph of your rising average
View a demo of Solo Events and discover more about SimGrid Pro Stats
60% Price Drop!
Performance Analysis is available to all SimGrid Pro subscribers. However to make SimGrid Pro more accessible to you I have decided to drop the price from €5 per month to €1.99 per month.
The price decrease of over 50% is with the view point that we want as many people on SimGrid to be able to analyse and improve their driving based on the data you produce after each and every race.
We obviously have much more planned for Performance Analysis, including comparisons across different drivers and teams and will be working flat out on these updates into the new year.
A big thank you to everyone on the SimGrid team for creating such an awesome app. I look forward to you giving it a try.